To explore the Dallas Murder data more yourself, check out my Shiny app here.
The code behind this blog post is on GitHub here.
Note, 1-11-2020: Data has been refreshed to include all of 2020.
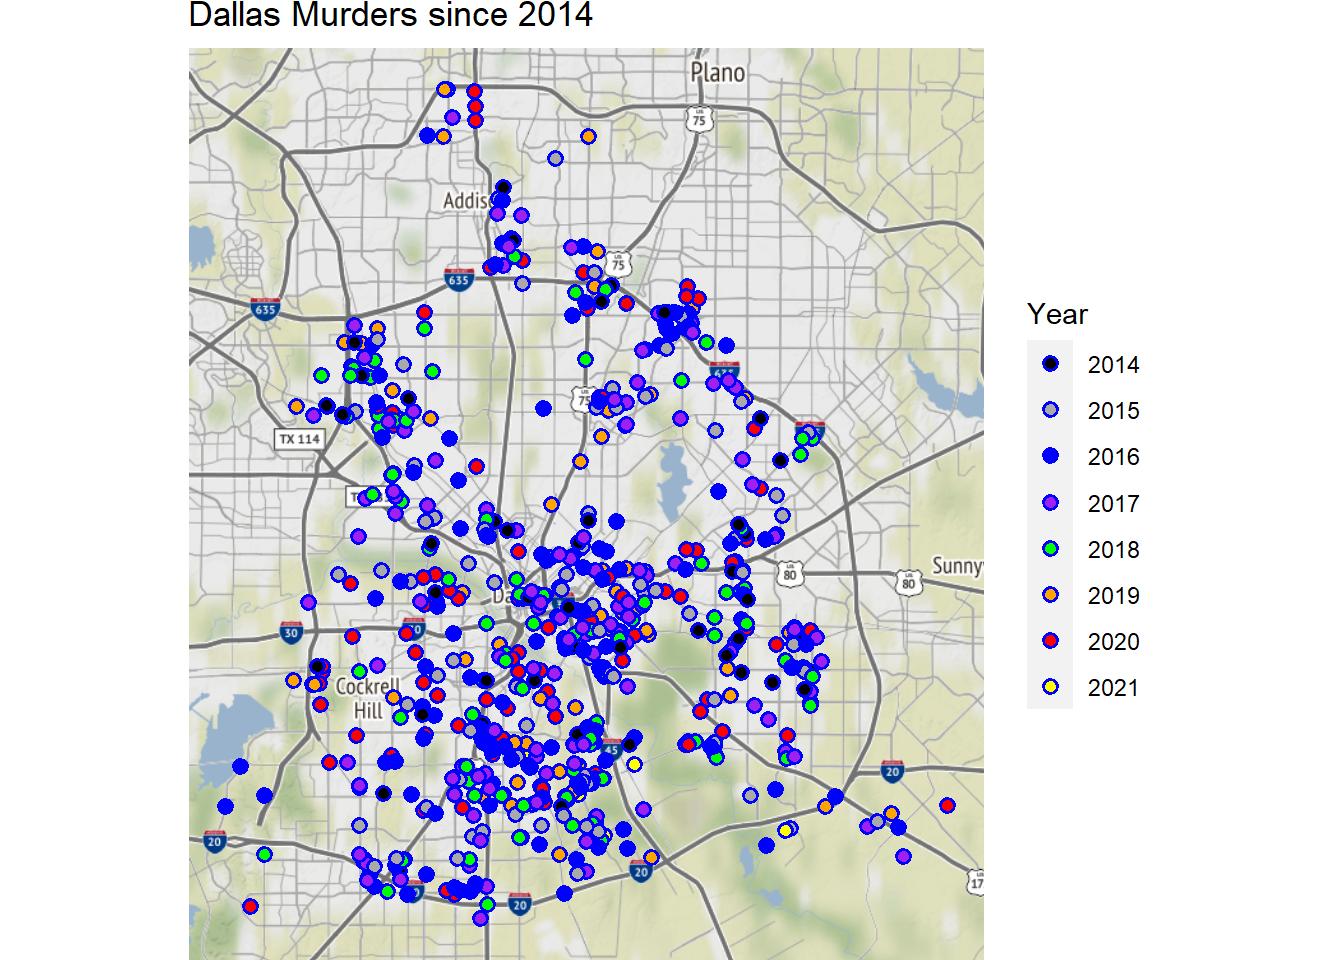
## Warning: package 'gifski' was built under R version 4.0.3All Dallas Murders since 2014, Color by Year
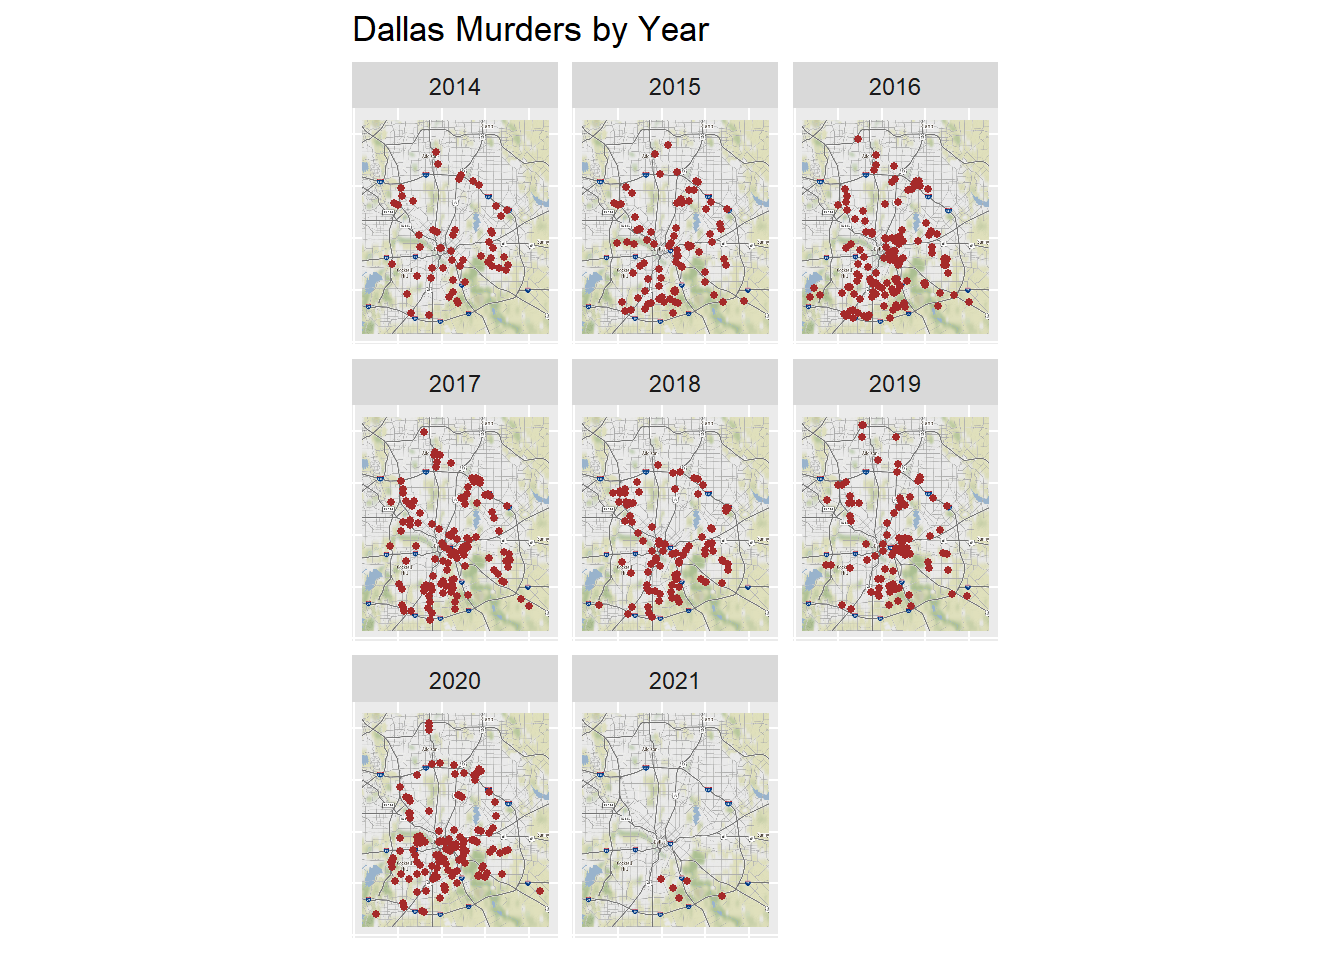
Let’s take a look at the Dallas murders on a map for each year.
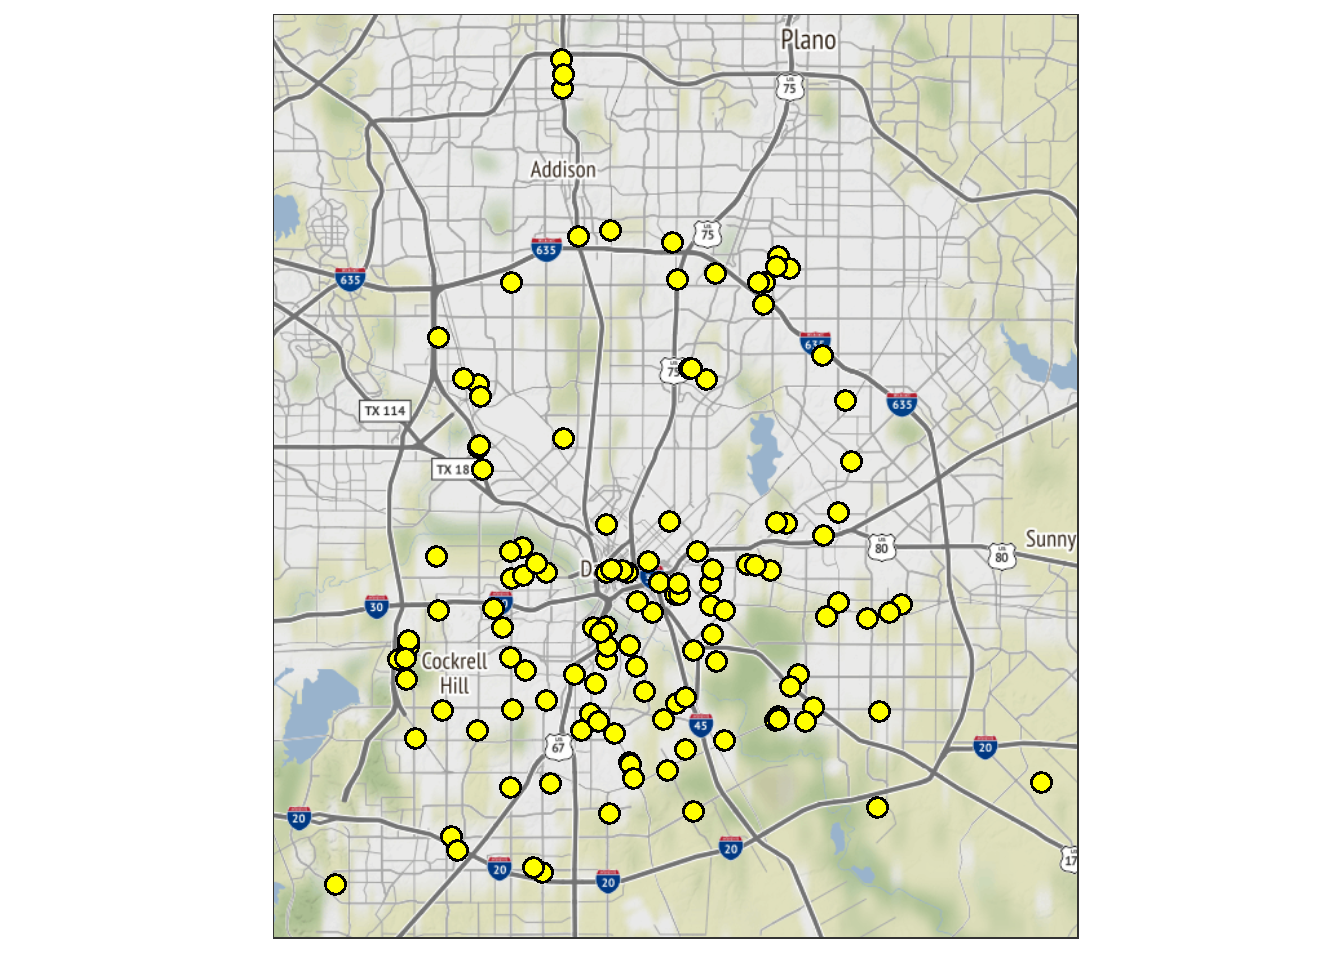
Let’s take a look at the murders just for 2020.
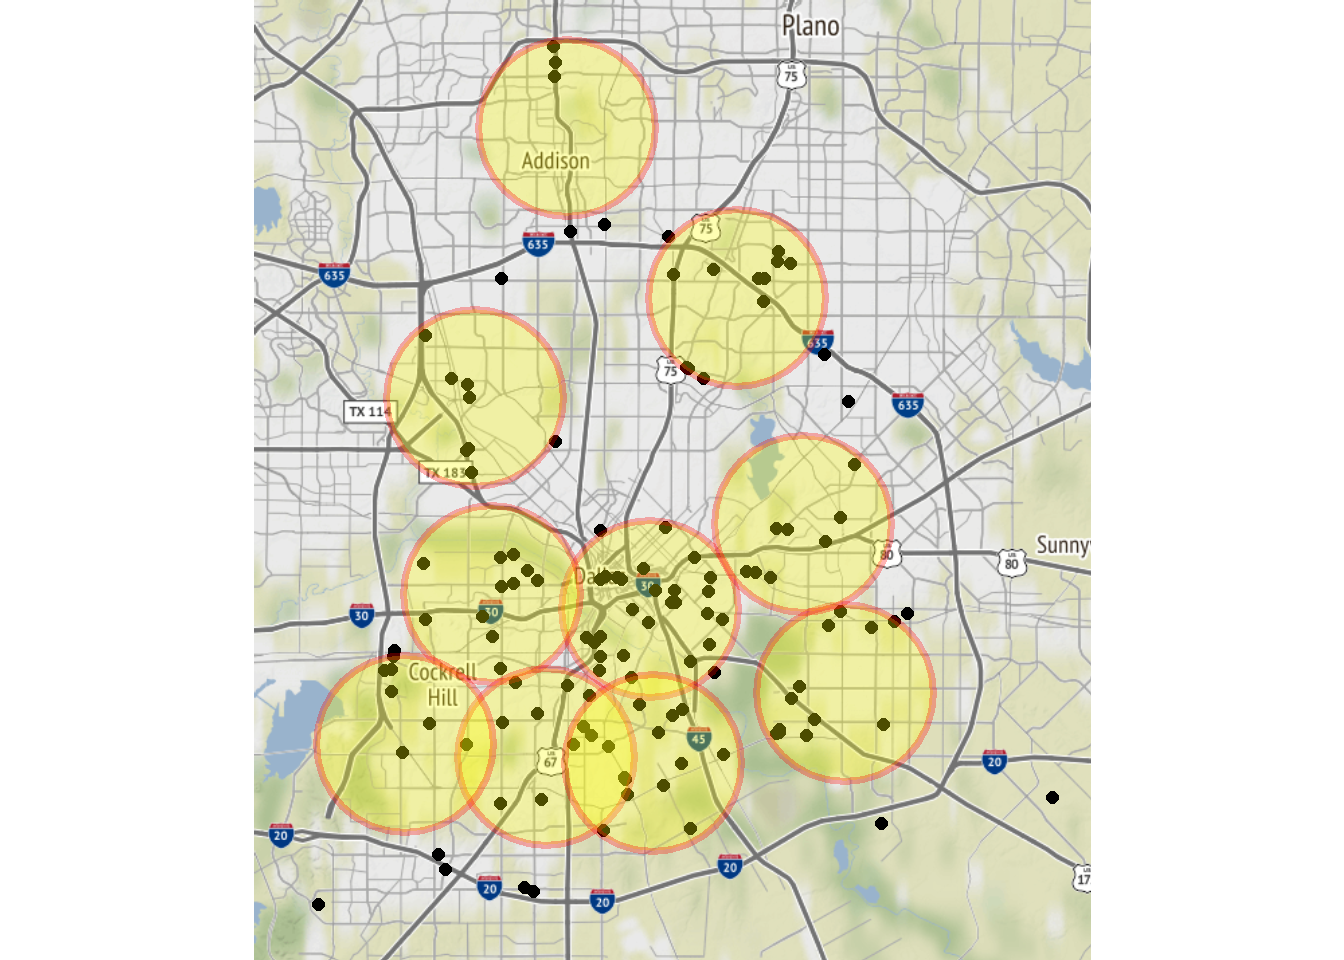
Cluster analysis: what are the centers of the murder areas? Let’s try K-means with 10 clusters.
Animate the murders by year.
Package “ggmap” citation: D. Kahle and H. Wickham. ggmap: Spatial Visualization with ggplot2. The R Journal, 5(1), 144-161. URL http://journal.r-project.org/archive/2013-1/kahle-wickham.pdf